Abstract
For the past century, movies have been one of the main sources of entertainment. But that’s not a surprise is it? Indeed, they’re magical. What do we mean by that? Well they have the remarkable ability to transport us to different worlds, reveal our deepest emotions, and leave lasting imprints on our memories. Whether it’s the edge-of-your-seat thrillers, heartwarming dramas, or mind-bending science fiction, movies captivate audiences globally.
In fact, we’d like you to pause a moment to think of your favorite movies. Which ones have shaped your childhood? Is there a character that you resonate with on a deep level? In fact, let’s appreciate how in only a few hours a movie manages to create “friendships” that we will remember forever. We are all unique individuals, yet we are united in the laughter, the tears and the fond memories that movies bestow upon us.
The creation of a movie is an art that is one of the most complex. Picture this! The writer imagines a story, the director gives life to it, the actors embody their characters and then the sound engineers and graphic designers craft the beauty of the final product. It is the symbiosis of these talented people that may yield a cinematic masterpiece which we movie-goers can truly savor.
Movie-making is complex! Notably because of our diverse preferences and expectations. We want novelty, yet we find comfort in the familiar faces of our favorite movie stars. Some movies reach billions in box office revenue, yet they don’t get the best ratings. We want to feel immersed in a compelling narrative, yet we constrain movies to only a few hours: more than three is excessively long. Some crave intense action, while others are bothered by it. We desire to escape, but also want to relate. The complexity lies in the intricate dance between these varied desires. What one person cherishes as a cinematic masterpiece, another might dismiss as a flop.
And yet, in the center of this labyrinth of preferences emerges a fascinating phenomenon - the blockbuster. These cinematic titans manage to resonate with diverse audiences, achieving financial success and cultural impact across the globe. Do these movies have common characteristics?
As we immerse ourselves in the enchanting world of cinema, it becomes evident that the definition of a “perfect” movie is as diverse as the people watching them. A great movie must navigate this complex landscape and can not please everyone. However, movie-success is not random. James Cameron, for instance, has written and directed three of the four highest grossing films: Titanic, and the two Avatar movies. Has he cracked the secret? If you work in the cinematic universe then your career goal is to get that secret formula. You, my reader, are probably not one of these people. Then why should you care what makes a great movie? The Secret Formula

Why should you care?
As we unravel the insights embedded in the data, we hope that you will embark on a journey of introspection. We encourage you to dive into the realms of your cinematic preferences. Our analysis looks at global trends, as such you may completely disagree with our findings, and that’s okay. Our mission is to give you a better understanding of the cinematic universe and your interest in it.
What makes a movie truly great?
Introduction
Welcome to our data story! Today you will embark with us on an exhilarating journey across the cinematic universe. Brace yourself for unexpected twists and turns. Before we start, we will explore the complex landscape of movie scores, where we will acquire essential metrics for the remainder of the trip. Our cinematic odyssey will begin smoothly with the impact of general features like movie duration and language. Then we will explore the diverse world of movie genres making a stop in the controversial land of sequels followed by the emotional planet of movie endings. Once in the universe of movie actors, we will delve into the impact of their diversity and fame on the score of their movies. Similarly, we will traverse its parallel universe of movie directors. Finally, we expect a gentle descent back to Earth where we will combine our insights to build the formula for a great movie. So without further ado, please sit back, grab your popcorn, and follow us on this quest. Together, let’s uncover the secrets that make a movie truly unforgettable!
Our Data
A famous saying in data science that stresses the importance of valuable data goes as follows: “Garbage in, garbage out”. In our case, it implies that if we want to extract valuable insights then we must enrich and preprocess our data. Initially, we wanted to use the CMU Movie Corpus dataset; however, we discovered that many of its ratings and box office revenues were missing. Instead of removing these movies, we decided to enrich our data with scraped data. Of course, there is no better website than IMDb to get the information that we want, so we did just that. You should also know that we used a few other datasets, notably of yearly inflation, but those will be mentioned later. In summary, we went out of our way to have as much valuable data as possible so that you may trust our findings.
Score
As we begin this journey, there is one essential question that we must answer! How do we measure movie greatness?
Our first intuition led us to believe that a key indicator of greatness lies in a movie’s box office revenue since it reflects the scale of its impact on society. Please think for a moment about the indelible mark that top-grossing movies like Titanic and Star Wars have had on people across the globe. However, to truly compare revenues from different times, they must be adjusted for inflation. Then we can uncover some of the hidden gems of the past that most of us have never heard of. In fact, as of 2023 Gone in the Wind, a movie released in 1939 holds the number one spot at a whopping 4 billion dollars:
| Rank | Title | Worldwide gross
(2022 $) |
Year |
|---|---|---|---|
| 1 | Gone with the Wind | $4,192,000,000 | 1939 |
| 2 | Avatar | $3,824,000,000 | 2009 |
| 3 | Titanic | $3,485,000,000 | 1997 |
| 4 | Star Wars | $3,443,000,000 | 1977 |
| 5 | Avengers: Endgame | $3,165,000,000 | 2019 |
| 6 | The Sound of Music | $2,884,000,000 | 1965 |
| 7 | E.T. the Extra-Terrestrial | $2,815,000,000 | 1982 |
| 8 | The Ten Commandments | $2,665,000,000 | 1956 |
| 9 | Doctor Zhivago | $2,526,000,000 | 1965 |
| 10 | Star Wars: The Force Awakens | $2,491,000,000 | 2015 |
This is interesting because it shows that seven of the most profitable movies were not in the 21st century (Wikipedia link)
While adjusted revenue is a gauge of the number of people impacted, it doesn’t necessarily reflect the quality of a movie. As such, we turn ourselves towards ratings which directly represent what moviegoers thought of the film.
Intuitively, the quality of a movie and its monetary success should be correlated; however, our analysis rejected that assumption! This might seem as strange to you as it did to us, so here’s some concrete proof.
Initially, we tested Spearman Correlation as it is often the go-to method for such problems. This yielded a relatively low statistic, 0.067, with a very small p-value, 6.2984e-19. These results reveal that we can say with high confidence that the two are not linearly correlated. Since they may have more complex correlations, we also went for the more robust statistic, Mutual Information. In essence, we quantify the amount of information obtained about ratings by looking at scaled revenue, and vice versa. This yielded a really low dependence score of 0.0236. These values might be hard to grasp, so we provide a visualization that will help you convince yourself. Thus we conclude that there is hardly any dependence between revenue and rating, and that both of them must be considered in our score.
We define the score as a function composed of two components:
- BORC : Box Office Revenue Component
- RC : Rating Component
These components can be computed with the Adjusted Movie Revenue (which we write as AMR) and the movie rating (we will write as MR)
We log-transform the data and define x = log(AMR) and y = MR
\[\begin{cases} BORC = \frac{x - \min(x)}{\max(x) - \min(x)}\\ RC = \frac{y - \min(y)}{\max(y) - \min(y)} \end{cases}\]We can finally define the final movie score as 0 to 100 score, with the better movies having a higher score.
\[MovieScore = 100\left(\alpha BORC + (1 - \alpha) RC \right)\]Note that we can tune alpha to increase the relative importance of one of the components. In the end, we chose to have equal weights as we deem both to be equally important. Please play around with the following visualization to get a feeling of what the tuning does and how it can significantly change our results.
Now that we have a robust metric for movie greatness, that considers its impact and quality, we can start our adventure.
Small Features
Movie Run Time
We set out to understand the relationship between the length of a movie and its score. What do you think we’re going to find? Filming a movie is expensive so each additional minute comes at a significant cost! Intuitively it would seem that longer movies should have higher budgets, and that may influence the quality of the movie. So we expect to find a small correlation between the length of the movie and its score. Now let’s see if we are right!
But, before we dive into the intricacies of our analysis, a crucial step awaits: removing the outliers. A few of our data samples have runtimes of over 500 minutes and have the potential to skew our analysis! Chances are, you’ve likely never come across a movie with such a long runtime, so let’s remove these extreme cases. Now that we have a cleaner dataset, we proceed to put our intuition to the test.
Testing for Pearson correlation between movie runtime and score results in a statistic at 0.3124 and a zero p-value. This test implies that we can assert a medium correlation between the two with very high confidence. Great, our intuition was right! Now to make the journey even more captivating, and this analysis further convincing, here’s a visualization that provides the evidence supporting our claims.
Movie Budget
While there undoubtedly exist cinematic gems crafted on modest budgets, it’s essential to acknowledge that financial constraints often shape the scope and scale of a project. What would you do if you became a director? Picture yourself in their chair. Perhaps you’d dream of enlisting A-list actors, assembling an exceptionally talented team, and utilizing innovative equipment. However, the reality is that these come at a high cost. Unless you’ve had past successes, finding the funds for your film will be very challenging. In this context, we sense a relation between a director’s status and the budgets at their disposal. This premise lays the foundation for our hypothesis that budget and score are correlated, which we will now prove!
Looking at the movies with the highest budgets we detect something strange: some of them are in the tens of billions! A quick internet search reveals the culprit: our data contains budgets in various currencies. To maintain the integrity of our analysis, we choose to discard movies with budgets surpassing the record holder: Pirates of the Caribbean: On Stranger Tides (2011) boasting a budget around around 300 million dollars. The Pearson correlation that follows yields a statistic equal to 0.3122 and an infinitesimal p-value around 1.3677e-206 which indicates a substantial correlation with very high confidence.
Note that, similar to box office revenue, budgets must undergo adjustment for inflation to ensure comparability across different years. In addition, it’s imperative to acknowledge that while our filtering successfully removed extreme budgets, there may still be inaccuracies in our dataset. As previously emphasized, the quality of our analysis is intricately tied to the integrity of our data. Hence, in this scenario, it’s important to approach our results with a degree of caution, recognizing the potential limitations in the dataset.
Genres
Our quest for the perfect movie formula leads us here, to the vast and diverse world of genres. Genres are the core of cinematic diversity, shaping a film’s storyline, tone, and emotional connection: elements that immerse you in a new world. So stay with us while we explore the impact of the 16 most popular genres on the movie score. There is so much more to discover together!
To get a global view of our data, let’s start by looking at the 4x4 subplots representing the distribution of the movie score per genre.
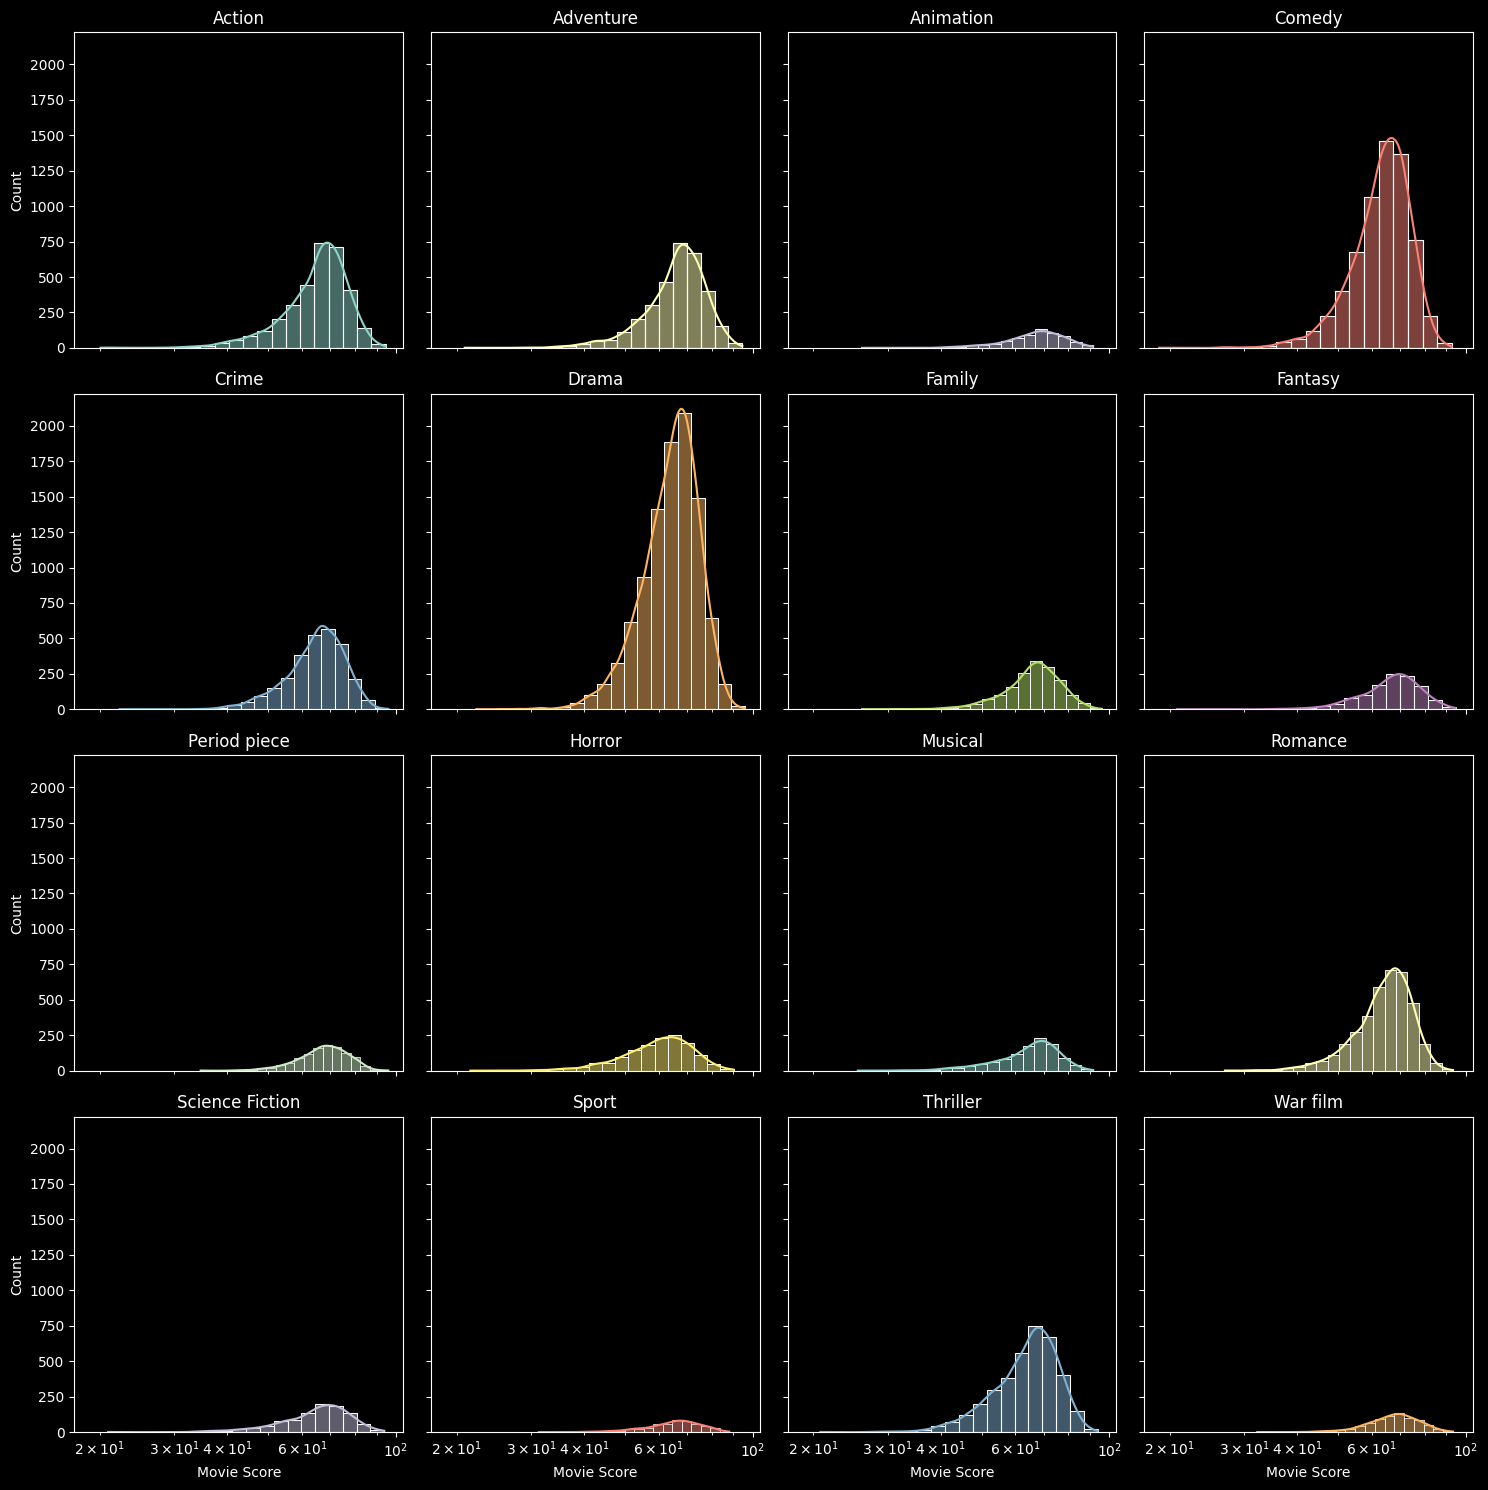
From these 4x4 subplots, some trends begin to arise. It seems like our movies are very imbalanced in their genres. Interestingly, it also seems like the less frequent genres are centered around higher movie scores than the more frequent ones. That’s intriguing, isn’t it? We are curious to know how that is possible, so we are going to look into the exact frequency of movies per genre through a pie chart, and then visualize movie score statistics per genre through box plots.
This pie chart unveils intriguing patterns, showcasing the prevalence of Drama and Comedy genres and the relatively rare occurrence of Animation and Sport genres. The dominance of drama and comedy films can be attributed to their widespread appeal and capacity to connect with varied audiences. Drama, often reflecting societal values and addressing social issues, resonates on a universal scale, while comedy offers entertainment and a form of escapism through humor and laughter beyond cultural barriers.
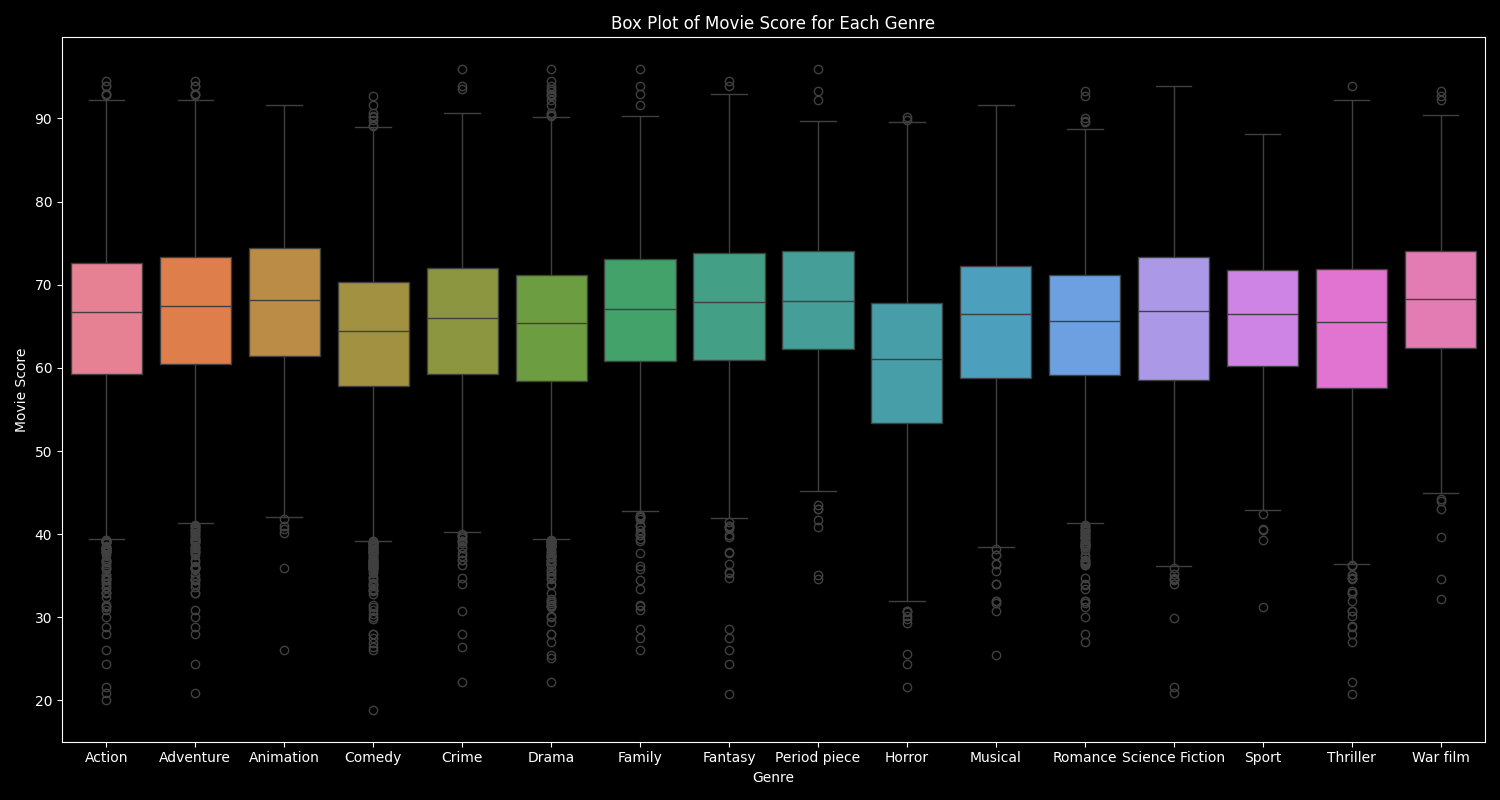
Confronted with these findings, a question emerges: Could the prolific release of movies in certain genres be attributed to a strategic understanding by directors of their greater success? So now that we have a better knowledge of movie-genre proportions, let’s see if the abundance of a genre correlates with the movie scores it achieves. With that in mind, we will use boxplots to visualize the distributions of movie scores for each genre.
| Action | Adventure | Animation | Comedy | Crime | Drama | Family | Fantasy | Period piece | Horror | Musical | Romance | Science Fiction | Sport | Thriller | War film | |
|---|---|---|---|---|---|---|---|---|---|---|---|---|---|---|---|---|
| Mean Movie Score | 65.451447 | 66.526025 | 67.463643 | 63.719516 | 65.224068 | 64.598715 | 66.472288 | 67.071766 | 67.824714 | 60.494450 | 64.905501 | 64.682798 | 65.605242 | 65.649396 | 64.376111 | 68.043597 |
| Median Movie Score | 66.730583 | 67.447774 | 68.139762 | 64.465856 | 66.026910 | 65.357683 | 67.062700 | 67.910670 | 68.102760 | 61.081979 | 66.517157 | 65.651986 | 66.794318 | 66.479787 | 65.536820 | 68.334888 |
| Maximum Movie Score | 94.563911 | 94.563911 | 91.640925 | 92.683054 | 95.908194 | 95.908194 | 95.908194 | 94.563911 | 95.908194 | 90.211079 | 91.640925 | 93.283655 | 93.846619 | 88.078265 | 93.949723 | 93.283655 |
| Minimum Movie Score | 20.068884 | 20.918441 | 26.091910 | 18.884183 | 22.265881 | 22.265881 | 26.091910 | 20.804988 | 34.584855 | 21.564511 | 25.494209 | 26.999474 | 20.918441 | 31.287348 | 20.804988 | 32.181485 |
As we can see in the boxplots and table above, the War film, Animation, and Period Piece genres have the three highest median scores, while Drama and Comedy have amongst the worst medians. Moreover, The Godfather, a movie that belongs to the Crime, Drama, Family, and Period Piece genres, has the maximum score, and it’s a Comedy movie, Underground Comedy Movie, that has the worst score. Could this be due to the fact that the number of movies per genre is not the same? Are our results biased, invalid?
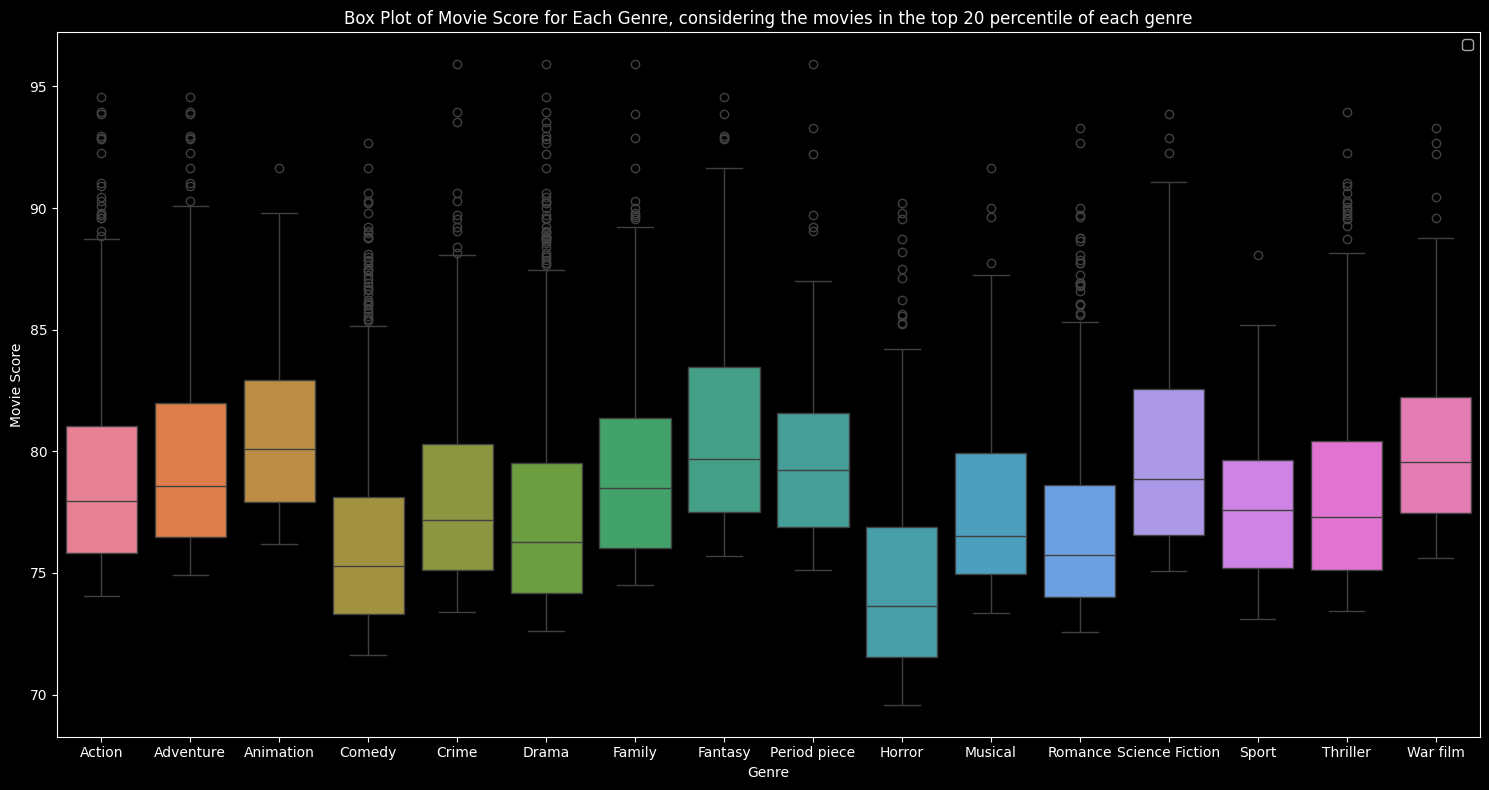
To answer this concern, we repeat the analysis twice:
- Once considering only the movies in the top 20 percentile for each genre
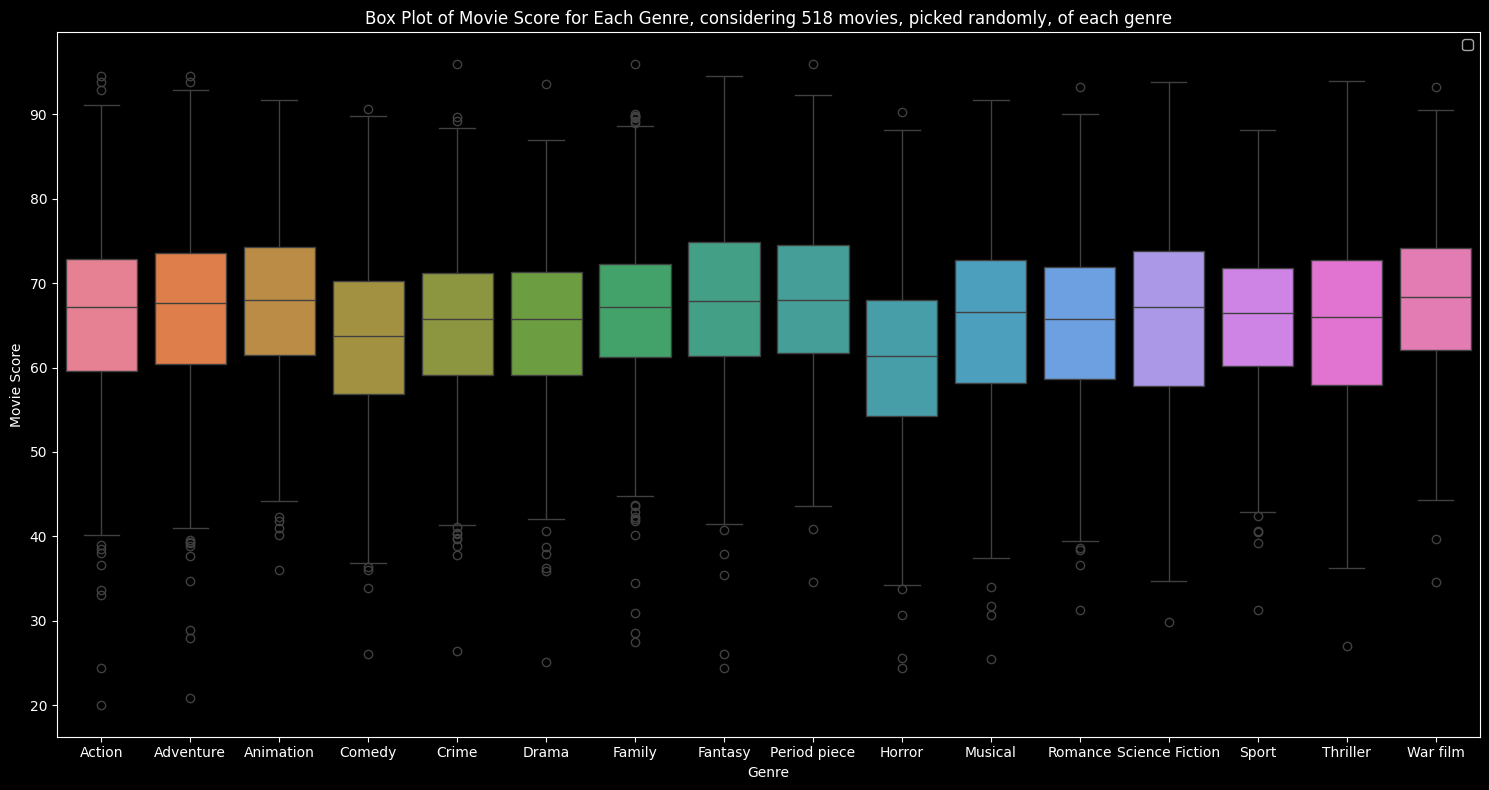
- Once considering only 518 randomly picked movies for each genre. We thought you might ask why 518? Well, the least frequent genre contains 518 movies. This way, we compare the genres with the same number of movies, so the same sample size.
- Considering only the movies in the top 20 percentile for each genre
| Action | Adventure | Animation | Comedy | Crime | Drama | Family | Fantasy | Period piece | Horror | Musical | Romance | Science Fiction | Sport | Thriller | War film | |
|---|---|---|---|---|---|---|---|---|---|---|---|---|---|---|---|---|
| Mean Movie Score | 78.957673 | 79.755090 | 80.907175 | 76.207954 | 78.062116 | 77.283932 | 79.469923 | 80.811275 | 79.680787 | 74.882624 | 77.774218 | 76.725863 | 80.085396 | 77.687364 | 78.172573 | 80.344810 |
| Median Movie Score | 77.951128 | 78.565831 | 80.079709 | 75.294924 | 77.173120 | 76.254495 | 78.477625 | 79.696348 | 79.232729 | 73.620020 | 76.498839 | 75.716243 | 78.853480 | 77.589971 | 77.299869 | 79.548541 |
- Considering only 518 randomly picked movies for each genre
| Action | Adventure | Animation | Comedy | Crime | Drama | Family | Fantasy | Period piece | Horror | Musical | Romance | Science Fiction | Sport | Thriller | War film | |
|---|---|---|---|---|---|---|---|---|---|---|---|---|---|---|---|---|
| Mean Movie Score | 65.951830 | 66.581591 | 67.553915 | 63.217043 | 65.067892 | 65.204043 | 66.395068 | 67.597616 | 67.996322 | 60.979393 | 64.953137 | 64.928572 | 65.801503 | 65.649396 | 64.947158 | 68.057620 |
| Median Movie Score | 67.120539 | 67.606817 | 68.027674 | 63.724167 | 65.766891 | 65.776623 | 67.183292 | 67.904150 | 68.054790 | 61.348350 | 66.583067 | 65.777915 | 67.116351 | 66.479787 | 66.019870 | 68.362822 |
Applying both methods, Animation, Fantasy and War film genres still have the highest means and median, and Drama and Comedy still have among the worst means and medians.
This trend that less popular genres are scoring higher in terms of average and median scores could be explained by genre expectations and audience saturation in frequent genres and the potential novelty and niche appeal within the least frequent ones, which attracts a more targeted audience. Moreover, movies that have a combination of multiple genres, like The Godfather, have appeared to be really successful. They blend together the best of these worlds, appealing to many more tastes and preferences and satisfying a broader audience. Ultimately, to make the perfect movie, producers should focus on innovation, surpassing genre expectations, and targeting a specific and dedicated audience, no matter the movie genre. At the end of the day, we, spectators, wouldn’t be impressed by 10 different movies that have almost the same story, right?
Movie Diversity
Ready to spice up our movie formula? Let’s move on to a topic that is becoming increasingly pivotal with time: movie diversity. When watching a movie, we want to match with the characters which is facilitated by physical resemblance, common origins, or similar gender identities. So come with us to analyze how we measure diversity, and how it contributes to movie success.
First, please note that for this study, we needed more information about the movie actors, so we scraped the Wikidata website. The dataset generated includes information about actors’ ethnicity and gender: wiki data sparql link.
Ethnicities:
Now, how diverse do you think are actors’ ethnicities in the movie industry? One would have thought that the most common ethnicity is “White” (human racial classification), but it turns out that it’s actually “Indian”.
As you can see, some of these ethnicities seem similar, like “American” and “Lebanese American”. Therefore, we decided to generate a network graph presenting ethnicities similarities in the entire film industry (similar ethnicity names are connected with a gray line). Three distinct clusters appear: in the middle, we have the well-known ethnicities, the small “line” on the left represents some extremely close ethnicity names, and the ethnicities forming the outside oval are all unique in a certain way, and don’t resemble other ones.
Next, we define a diversity threshold: movies with at least three different ethnicities are considered diverse.
As seen on the left histogram, movies all have more than 3 different ethnicities. However, that is not actually true. For example, some movies say they cast actors from 2 ethnicities “American German and German American”, but these are technically the same, so they should not be counted twice. Which is why we also established the histogram on the right, after having removed these duplicates. We notice that most movies cast actors from 2 to 4 different ethnicities. This distribution reflects producers’ effort towards making their movies more inclusive, grouping actors from different cultural backgrounds.
Now, does being more inclusive mean being more successful? It seems like it! After doing some statistical tests, we obtain that with 95% confidence, the mean movie score of inclusive movies (number of ethnicities above threshold) falls within the range [66.0940, 66.6166]. The mean movie score of exclusive movies, however, is between [62.5040, 63.7419]. This can also be seen in the below point plot.
Genders:
Join us now while we delve into another integral inclusivity feature: gender representation. Movies most often mirror society, and its dynamics. As gender equality gained importance in real life, it also did in movies, moving from traditional roles to more inclusive and nuanced ones. Again, for this analysis, we defined a range determining if a movie is balanced or imbalanced: if the proportion of male actors is between 0.4 and 0.6, the film is considered balanced, otherwise it is imbalanced. It turns out that 11.38% of the movies are gender imbalanced in favor of women, and 88.62% are gender imbalanced in favor of men.
Below, you can see the number of movies per percentage of male actors. The distribution seems to be centered around 0.65, which explains the 88.62% value.
We then obtained surprising results: gender imbalanced movies had an average mean movie score within [67.6733, 68.5867], which is higher than [65.6577, 67.1005], within which gender balanced movies’ mean movie score lie, both with 95% confidence.
So till now, movies with more gender imbalance have been more successful. However, this is unethical, and in a world where we are all constantly fighting for equal gender rights and representation, we will not encourage producing movies with more male actors, than female actresses. We advocate for a diverse and gender inclusive and balanced filmmaking industry that is more creative and authentic, that reflects our society and that connects with a broader and more diverse audience.
Movie Sequels
Let’s now venture into the realm of sequels. A movie’s typical duration, spanning from one and a half to three hours, often feels too short a time to dive into a world and create profound relationships with its characters. We’d like you to think about the character that you love the most. Was that relationship built across multiple films or just a single one? Movie series offer a solution, providing a canvas to witness the evolution of characters over time. Many of the most iconic blockbusters fall into that category: Star Wars, Avatar, and the Marvel Cinematic Universe movies. This begs the question: are sequels, in general, a crucial element in the formula for a successful movie?
Firstly, we compare sequels with movies that are not sequels to see if the score distributions are significantly different in the two groups.
The above box plots seem to show that sequels boast significantly better movie scores than their non-sequel counterparts. However, it is important to note that there are much fewer sequels, prompting a statistical investigation. Consequently, we perform a t-test to back up our findings with some statistics. With an extremely small p-value of e-38, much smaller than a typical significance level of 0.05, and a t-statistic of 12.8826, we find that there is a significant difference between the two populations’ scores.
Adding another layer to our analysis, we are interested in comparing how well prequels perform compared to sequels within a movie series. To analyze this we subtract the prequel’s score from all the movies that came after it in a movie series. This yields very interesting results as we can see in the following plot that the overwhelming majority of sequels fall short of their predecessors. This paradoxical observation might be attributed to the perception that movie series lack creativity, thus influencing critics to assign lower ratings.
Our findings are captivating because they paint a nuanced relationship between sequels and movie scores. We saw that sequels are more likely to have higher scores than their counterparts. Yet, we found that sequels generally underperform compared to their prequels. These insights seem contradictory right? A possible explanation would be that a movie is more likely to have a sequel if the previous one was received well. Therefore, merely creating a sequel isn’t a guaranteed formula for success; however, if the prequel garnered a positive score, it might offer a relatively secure path.
Famous Actors
Intuitively, the cast of a movie has a significant influence on its success. Indeed, if an A-list actor announces their new movie then many of their fans will rush to cinemas to watch the newest masterpiece. This is especially true for successful actor duos. For instance, if the funniest duo (in our opinion of course😂), The Rock and Kevin Hart, act in a movie, not only would we all go watch it, exploding the box office revenue, but also the movie would naturally be a success.
In light of this information, we want to come up with a metric for measuring an actor’s popularity. Ideally, we would like to use Google Trends however many movies in our dataset were made long before social media 😅. But fear not, as we have found a clever solution to solve this issue
Defining actor popularity as the mean value of scores from their 5 previous movies seems like a strong solution. Considering a limited window of the most recent films offers a snapshot of an actor’s current influence in the industry.
Now to validate the strength of this system, we’d like to check that top names can be found. Who would you want to feature in the most popular actors?
Well, after taking the mean popularity over all their movies, it unsurprisingly turned out that among the top-10 most popular actors, there are: Tom Hanks, Harrison Ford, Brad Pitt, Robert De Niro, and Johnny Depp. These seasoned actors have consistently delivered performances that resonate with audiences, earning them enduring popularity throughout their careers.
The main question remains unchanged: do actors’ popularity scores affect the movie score?
Let’s look together at the plot of actors’ popularity as well as mean movie scores over the respective years. 95% confidence intervals are also shown for convenience.
Looking at these plots, we can see that the actors start at 0, but quickly reach top scores due to the nature of our metric. Furthermore, since the metric itself is defined as a derivative of the movie score, it is natural for it to follow the score trend.
The visual similarities in the two curves tempt us to try and predict movie score based solely on actors’ popularity. The big question becomes: Can we define an accurate movie score predictor based solely on the actors in its cast?
Predictor
The predictor that we propose takes the score of the top actors and returns their average. motivated to find the best model, we can tweak the number of actors considered in our mean.
The graph above represents the mean movie score over the years and the mean predictions for the same years, both with a 95% confidence interval. Note that you can change views to see how the model performs when you consider different numbers of actors.
The results when considering a single actor are quite impressive. In other words, predicting the score of a movie as the top actor score in its cast is a terrific predictor. It is worth noting that before the 1940s our prediction was terrible, which is probably because at the beginning of our data, actors are unseen and thus have very low scores.
These findings underscore the significant influence that actors can wield in shaping a movie’s success. Shedding light on why some of them are paid so well!
Famous Producers
Behind every good movie is a good producer, right? This leads us to this new analysis, revolving around Producers’ Fame.
Defining the similar metric used for actors’ popularity, but now for movie producers shows almost the same results. Among the top 10 producers of all time, there are: Steven Spielberg, Woody Allen, Martin Scorsese, Alfred Hitchcock, and Ridley Scott.
Here again, it seems like the producers’ popularity hugely depends on the movie scores of previous movies they produced, the variation of the scores of those movies, and on the length of the producers’ careers.
Good or Bad Ending
Transitioning into the exploration of how the type of movie ending influences its success, we invite you to reflect on those moments when you left a theater with tears streaming down your face or laughter echoing in your ears. The strong emotions that you can get in the closing scenes are likely to leave a lasting impression. For instance, the sad farewell to Iron Man left many viewers (including us) in tears, evidence of the power of an emotional ending. It remains noteworthy that movie-goers desire different emotions from various genres. Indeed, a Horror movie with a happy ending would probably be disappointing, whereas it is exactly what we love in their Animated counterparts. Additionally, we could also expect the intensity of the sentiment to have an influence, as the impression of a high-intensity ending leaves a mark.
Sentiment Extraction
But how can we extract the intensity and sentiment of endings from the data that we have? Navigating, through our dataset, we found a creative solution. Firstly, we determined that we could extract the endings from the last three sentences of the plot descriptions, which we had in our data. Then all we had to do was to use open-source models to extract the sentiment from the text. Easy!
To give you more visibility on the matter, here’s an example that’ll surely help. We will take the example of the world-renowned masterpiece, The Lion King.

“Scar survives the fall, but is attacked and killed by the hyenas, who overheard his attempt to betray them. With Scar and the hyenas gone, Simba descends from the top of Pride Rock where he is acknowledged by the pride as the rain falls again. Sometime later, Pride Rock is restored to its former glory and Simba looks down happily at his kingdom with Nala, Timon, and Pumbaa by his side; Rafiki presents Simba and Nala’s newborn cub to the inhabitants of the Pride Lands and the circle of life continues.”
You can find above the text that our method extracts as the “ending”. It is fair to say that the death of the villain and the hero’s happy ending are included and quite detailed. But now let’s see what sentiment is detected here, seeing as we would qualify it as a positive ending. The predicted value is 0.8519 for the compound end sentiment, in a range going from [-1; 1], where -1 is a very negative sentiment and 1 is the opposite.
We apply this method to all our movies and plot the following heatmap of ending sentiment versus movie score.
Intriguingly, the heatmap reveals the presence of hot spots, the movie endings are agglomerated in 3 spots, very negative, very positive, or neutral. Moreover, this graph shows little to no correlation between the movie score and the ending’s sentiment, whether negative or positive, as data suggest a consistent dispersion of movie points around the score of 65. While this plot reinforces the notion that movie scores, in general, aren’t strongly correlated with ending sentiment, it doesn’t necessarily contradict our earlier hypothesis. Indeed, we expected certain genres such as Horror movies to be more prone to a side of the spectrum. To put this claim to the test, let’s delve into the sentiment distribution within different genres!
Our initial attempt to assess correlations using Pearson Correlations faced challenges, with low statistics indicating minimal linear correlation. Furthermore, the majority of p-values exceeded our confidence level of 0.05, preventing us from rejecting the null hypothesis. Could the correlations not be linear? In that case, Pearson would not fit the task. Considering this eventuality, Mutual Information was computed, yet that yielded the same conclusion: movie success does not depend on the sentiment of its ending! Note that a Mutual Information of 0 essentially means that the two are independent.
Then to push our analysis further, we considered the ending’s intensity as an influencer of movie score. Same as before, we plot movie density as a function of score and sentiment intensity.
Once again, no clear pattern comes out of this plot other than that the overwhelming majority of movies are categorized as high-intensity. This is not great for our analysis as unbalanced data limits our insights. Still, we compute a statistical test notably a Pearson correlation and Mutual Information to test for non linear correlations.
Once again, the results show that there is no significant correlation between the two. In fact, some genres such as “Adventure” have no mutual information with the score! In essence, our initial hypotheses were completely wrong. The sentiment of a movie’s ending whether it be good/bad or intense/calm, does not influence its success!
Ending our Journey
Returning to solid ground after a thrilling exploration of the cinematic cosmos, we now find ourselves equipped with knowledge acquired along this fascinating journey. Initially, we concluded that not all countries and languages were equal in their success. In the same breath, we unearthed that both movie runtime and budget are positive influencers of score. Then, as passionate movie fans, we were eager to explore the intricacies of movie genres. Our analysis focused on the 16 most popular genres, and we were ecstatic when we discovered the paradox that the most prevalent genres often do not secure the highest scores. We hypothesized that this was because people like novelty, but what do you think about this intriguing result? Once we had cracked the secrets of genres, we transitioned to the nuanced world of movie series. There we discovered that sequels in general perform much better than other movies, but that surprisingly sequels fell short of their predecessors in the overwhelming majority of cases. Transitioning to the emotional land of endings we were surprised to find out that they have virtually no impact on scores. Subsequently, we were proud to explore the novel concept of diversity and examine trends concerning movie success. Yet the results left us with mixed feelings as we found that ethnic diversity was positive, but gender balance was negative. Finally, we were happy to finish with actors and producers where we proposed a novel way of ranking them.
Now, as we stand at the crossroads of our cinematic exploration, the time has come to consolidate our findings. We will embark on a comprehensive analysis, employing linear regression with all our features to unveil the intricate interplay of factors influencing movie scores. This holistic approach allows us to examine the collective impact of various elements and identify the features with the highest weights in shaping the success of a movie.
Linear Regression:
While we embark on this linear regression that will participate in building our final formula there are multiple things that we must consider. Firstly, it is essential that all our features be normalized so that the learned weights will reflect better the importance of each feature. Then the big question that we must answer is the following: What features are we going to include? One could say that we should include all of them as we want the most accurate model possible; however, in light of the influence that we found gender imbalance to have on movie score, we chose to ignore it in our model. Indeed, we do not want to propagate unethical analytics that could be used to perpetuate inequality. Additionally, we chose not to include whether a movie is a sequel from a movie series as our findings showed that sequels are nuanced and can’t simply be applied to any movie to have success. In the end, we have a set of 123 features.
Results
The R-squared value is a statistical measure that represents the proportion of the variance in the dependent variable (in this case, movie score) that is explained by the independent variables (features) in the linear regression model. The R^2 value ranges from 0 to 1, with 0 indicating that the model does not explain any variance, and 1 indicating that the model perfectly explains the variance in the dependent variable.
In our case, an R^2 value of 0.29 means that approximately 29% of the variability in movie scores can be explained by the features included in our linear regression model. While it doesn’t account for the entirety of the variance, it indicates a substantial portion of the variation is accounted for, providing a reasonable level of confidence in the results obtained. But what are the findings?
In the graph below, we presented the top 20 (in green) and worst 21 (in red) features that influence movie score the most positively and negatively respectively. Note that the y axis represents the weight of that parameter in the linear regression, so the higher the absolute value, the more influence it has.
Building our Formula for a Great Movie
The linear regression model analysis sheds light on the intricate tapestry of factors influencing movie scores, offering a nuanced understanding of what contributes to cinematic success. At the forefront, the positive impact of runtime suggests that audiences tend to appreciate movies with longer durations, allowing for more in-depth storytelling or character development. Moreover, the emphasis on ethnic diversity, as indicated by the second highest weight for the ethnic count, underscores the growing recognition of the importance of representation in cinema, contributing positively to audience engagement and appreciation.
Additionally, we found that genre preferences play a pivotal role, with Drama, Animation, Romance, and Science Fiction emerging as genres positively correlated with higher scores and thus movie success. Interestingly, our statistics showed that Drama and Romance were the first and second most abundant genre types; however, Animation and Science Fiction movies are among the least common which means that there would be much to gain from developing more movies in those domains!
Interestingly, the positive influence of certain countries, such as Japan, the United States, and Hong Kong, suggests that the geographical origin of a film can impact its perceived quality. Conversely, movies from Mexico, Canada, Russia, and Switzerland have a bad history of movie popularity. Notably, the global nature of the film industry is questioned, as significant contributors such as India and China exhibit a substantial negative impact on scores. Quantity does not mean quality!
The complex landscape of language preferences is evident, with French movies receiving very positive recognition, while Hindi films and indie productions face a more challenging landscape. A seemingly contradictory result lies in Bollywood’s success when Hindi films perform so badly. We don’t know the Indian cinematographic landscape enough to figure out why that is.
Additionally, our previous analysis reflected that the top actor in a cast is a great predictor of a movie’s score. This finding reflects the importance of having A-list actors!
Finally, we’d like to add that as we discovered in this data story, sequels navigate a nuanced landscape. Indeed, they can achieve much better results than the general movies; however, that is only if the prequel is successful. Yet one must be prepared for a regression as they rarely perform better than the predecessors!
In conclusion, the derived formula encapsulates a multi-faceted understanding of movie success, considering factors ranging from runtime and ethnic diversity to genre, country of origin, and language.
Closing remarks
As we bring this cinematic journey to a close, we invite you, the reader, to reflect once again on the intricacies of your cinematic preferences. Our exploration into the realms of movie scores, genres, and diverse features has unraveled many mysteries of the cinematic universe. If anything, we shed light on the complexities of this world, yet we hope that we succeeded in providing you with a better understanding of it. We encourage you to continue this exploration discovering new worlds, forging connections with unforgettable characters, and embarking on new journeys. Remember! Enjoy the moments of laughter and tears as you create everlasting memories.
As the credits roll on this data story, we thank you for joining us!
Anthony Kalaydjian, Anton Balykov, Yara Sabbagha, Eric Saikali, Aymeric de Chillaz